When using a table chart, it's possible to style individual cells to your liking. You can bold, italicize, and underline the text in the cell, align it to the left, right, or center, as well as superscript or subscript the text.
- Double-click the table chart or select it and expand the Edit data tab on the right.
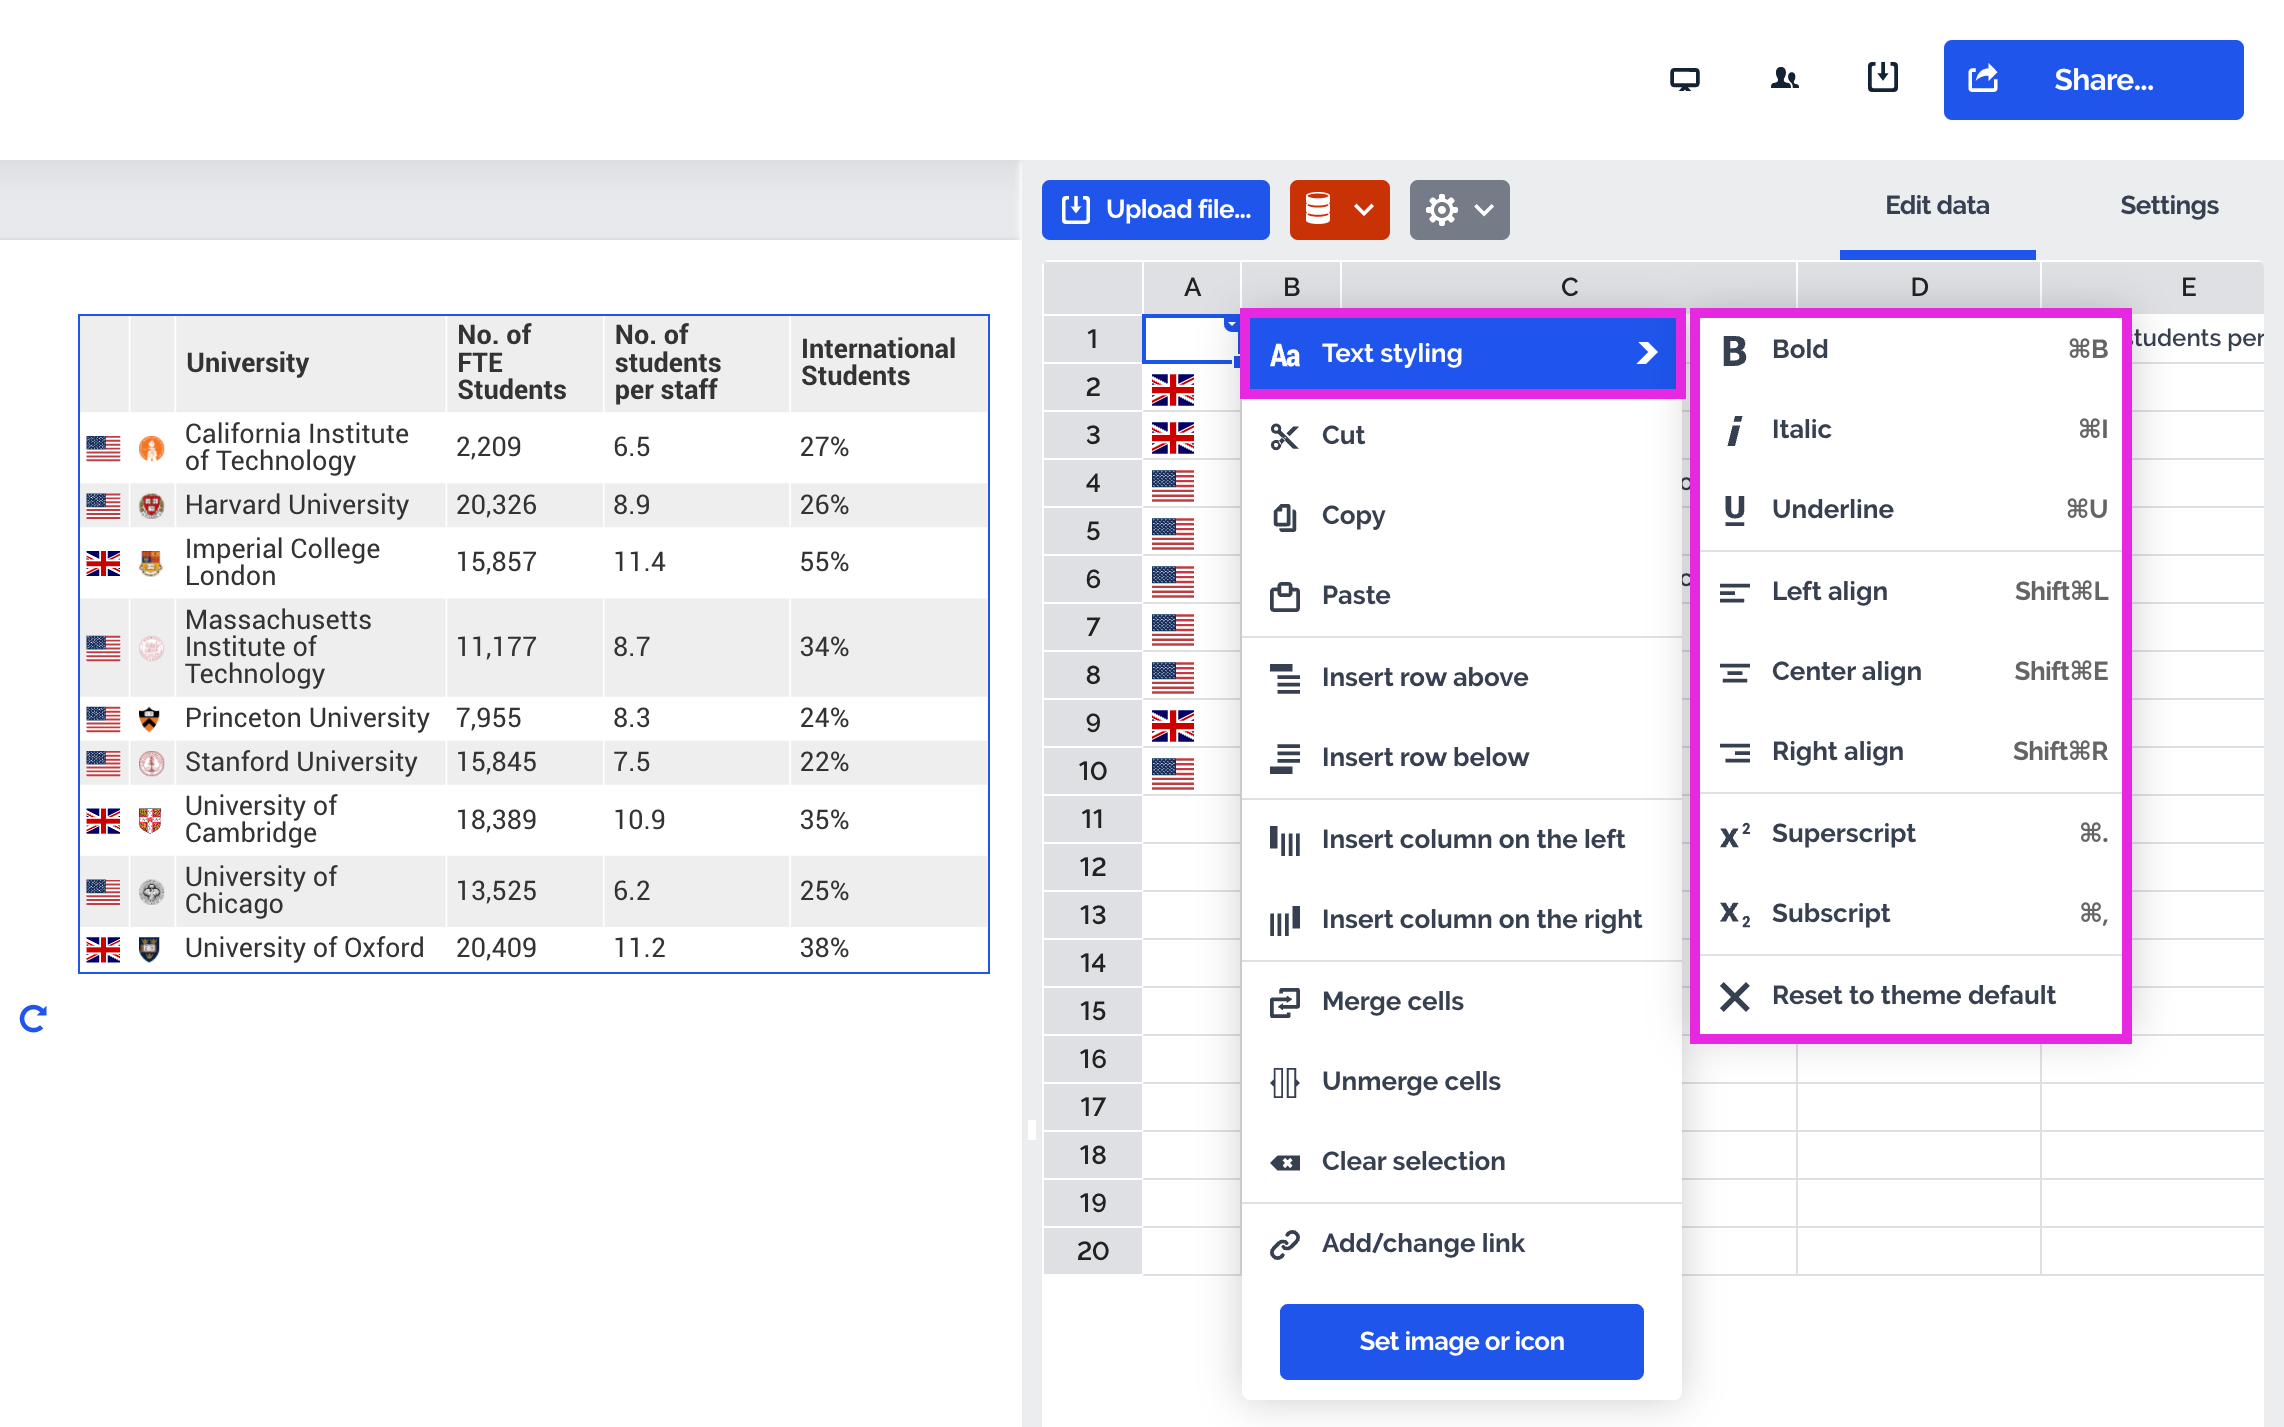
- In the datasheet, select the cells you wish to edit and right-click on them.
- Choose Text styling.
- Click on the available styling options or use keyboard shortcuts.
Bold: Cmd + B
Italic: Cmd + I
Underline: Cmd + U
Left align: Cmd + Shift + L
Center align: Cmd + Shift + E
Right align: Cmd + Shift + R
Superscript: Cmd + .
Subscript: Cmd + ,
Bold: Ctrl + B
Italic: Ctrl + I
Underline: Ctrl + U
Left align: Ctrl + Shift + L
Center align: Ctrl + Shift + E
Right align: Ctrl + Shift + R
Superscript: Ctrl + .
Subscript: Ctrl + ,
☝️
Note: It will not be possible to style cells in the first column or row if you have enabled Merge first column or Merge first row in the Table properties tab, in chart settings.
You can also change the font used in the table chart. Head over to the article on editing fonts of charts and maps to learn more.